

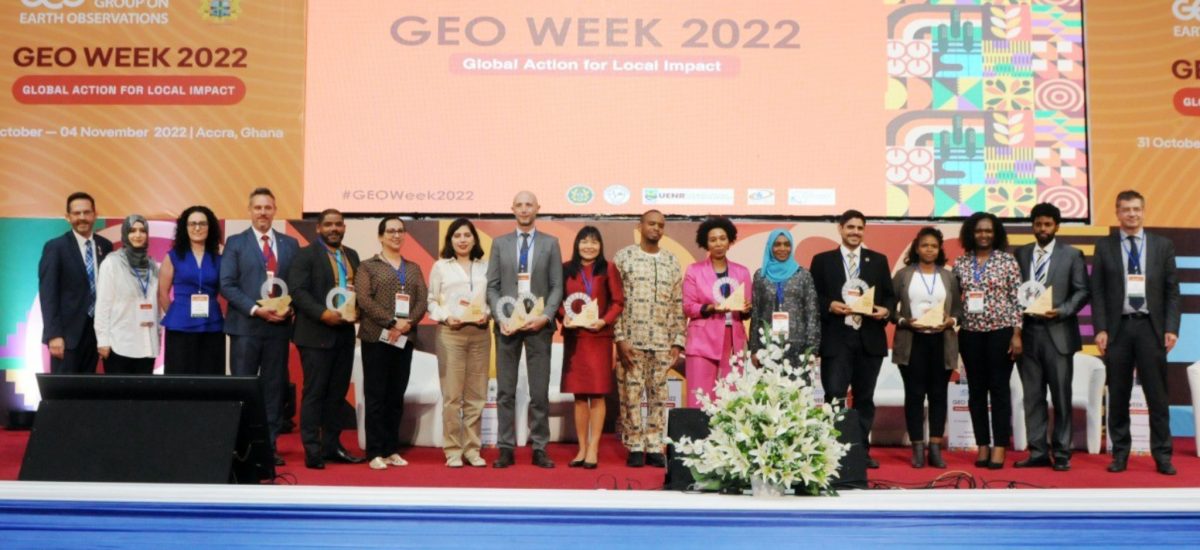
Digital Futures Researchers Won GEO SDG Award for KTH at the GEO Week 2022 In Accra, Ghana
KTH Royal Institute of Technology in Stockholm, Sweden, has been playing a leading role in leveraging Earth observation big data for urban mapping and urbanization monitoring to support sustainable and resilient urban development. During the GEO Week 2022 in Accra, Ghana, KTH received the GEO SDG Award for the Academia Category, assessed by eight panellists in terms of overall impact, quality and soundness of the Earth observation endeavours and their potential to be replicated and scaled up.
Launched in 2019, the GEO SDG Awards, led by the GEO EO4SDG initiative, recognize institutions, organizations, and countries applying Earth observations to achieve Sustainable Development Goals. Group on Earth Observations (GEO) is a partnership of more than 100 national governments and over 100 Participating Organizations that envisions a future where decisions and actions for the benefit of humankind are informed by coordinated, comprehensive and sustained Earth observations.
Through the EO-AI4GlobalChange project funded by Digital Futures, the KTH team, led by Professor Yifang Ban, developed two Google Earth Engine applications that were selected for recognition. The first application is for Interactive City Definition and Automatic SDG Indicator 11.3.1 Land Use Efficiency Calculation. The City Definition Tool can automatically and interactively generate city definitions based on the Degree of Urbanization endorsed by the UN to make the performance of different cities comparable. The SDG 11.3.1 Calculator calculates and visualizes the SDG11.3.1 primary and secondary indicators, following the global indicator methodology adopted by the UN Habitat guidelines. The application was designed on a Google Earth Engine backend and is fully functional on a web browser without additional installations. Several open-access global population datasets and EO-based built-up products in the EO4SDG11 Toolkit are available through the app and can be used to compute the indicator. The app enables users to compare different global populations and EO-based built-up datasets directly within a web browser and allows users to input their data and adjust the boundaries of their city definition when needed. This app was developed by Yifang Ban and Hui Zhang, a Research Engineer.
The second application is for urban data comparison. Derived from open data from Earth Observations, these global urban datasets used for SDG11.3.1 indicator calculation have different characteristics and qualities. As different datasets may produce different results for the 11.3.1 indicators, this app allows users to compare several urban datasets with satellite SAR and optical images, choose the most suitable datasets for their city, or decide to use their own data. This app was developed by Yifang Ban and Sebastian Hafner, a PhD student at the Division of Geoinformatics at KTH.
Both apps are easy to use and can be utilized by any city in the world for their SDG indicator 11.3.1 monitoring and progress reporting.
Testimonials
Dennis Mwaniki, Spatial Data Expert, & Robert Ndugwa, Head of Data & Analytics Section, UN-Habitat:
– The innovative tool not only provides an easy way to extract information from EO data and compute SDG 11.3.1 core and secondary indicators following the global indicator methodology (including adopting the harmonized DEGURBA methodology) but also gives the user the power to input their own data and adjust boundaries where inconsistencies and/or misclassification is noted. This flexibility and the simplicity with which the tool enables users to visualise and interact with the diverse archive of EO products makes it an invaluable resource that will significantly improve data production at the local level and enhance SDG 11.3.1 monitoring at the global scale.Maria Uggla, Geodata Strategist, The City Planning Office at the City of Stockholm:
– For Stockholm, it is important to analyze how different measures taken by the city add up to fulfil the sustainable development goals, and it is very good to be able to compare analyses to other cities. This can often be tricky as the cities, described by their administrative borders, contain areas of different degrees of urbanization. Some only have densely populated areas, and some include many rural areas. Using the app SDG 11.3.1 Indicator Calculator, we can very easily get a definition of the city that can be compared to others, as well as get the indicator values presented in an accessible way. Since different data sets have different characteristics and quality, we also appreciate the Urban comparison app that makes it easy to assess which data are suitable for different use cases and help interpret the results.Eric Mackres, Senior Manager, Data and Tools, WRI Ross Center for Sustainable Cities, World Resources Institute
– It was very exciting to see your demonstration of the SDG 11.3.1 app today on the EO4SDG Toolkit call. Thanks for all your hard work on this. It is great to see all these pieces brought together in a useful way for cities.
Background information
SDG indicator 11.3.1, Land Use Efficiency
Primary Indicator: The ratio of the land consumption rate to the population growth rate
Secondary Indicator: Land Consumption per Capita
Secondary Indicator: Rate of Urban Infill
The city definitions generated using this app are downloadable and can be used for other SDG indicators, including:
11.2.1 Population that has convenient access to public transport
11.6.2 Annual mean levels of fine particulate matter (e.g. PM2.5 and PM10) in cities
11.7.1 Open public space for public use for all.
The app for indicator 11.3.1 can also be easily adapted to calculate urban green space per capita, an indicator within the UN Habitat’s Global Urban Monitoring Framework.
Links:
https://eo4sdg11.users.earthengine.app/view/sdg-1131-indicator
https://eo4sdg11.users.earthengine.app/view/urban-comparison
![]()
![]()